📊 Reporting Systems & QA Dashboards
A collection of reporting systems, operational dashboards, QA metrics, and automation solutions engineered using Google Sheets to improve visibility, automate reporting, and support data-driven decision making.
Overview
One of the most impactful engineering solutions I've built is a collection of automated reporting systems and QA dashboards designed to replace manual reporting with real-time operational insights.
These dashboards reduce reporting effort, improve collaboration, and provide stakeholders with immediate visibility into testing progress, operational performance, and release readiness.
These dashboards reduce reporting effort, improve collaboration, and provide stakeholders with instant visibility into testing progress, operational performance, and release readiness.
Engineering Snapshot
- 6 Reporting Systems engineered using Google Sheets
- Real-time QA Metrics & KPI Dashboards
- Automated Operational Reporting
- Cross-sheet Data Integration
- Formula-driven Process Automation
- Executive Reporting & Visualization
🖼️ Dashboard Gallery
Explore a selection of the reporting systems and quality dashboards I've engineered. Each dashboard was designed to solve a specific operational or quality assurance challenge through automation, live reporting, and clear data visualization.
-
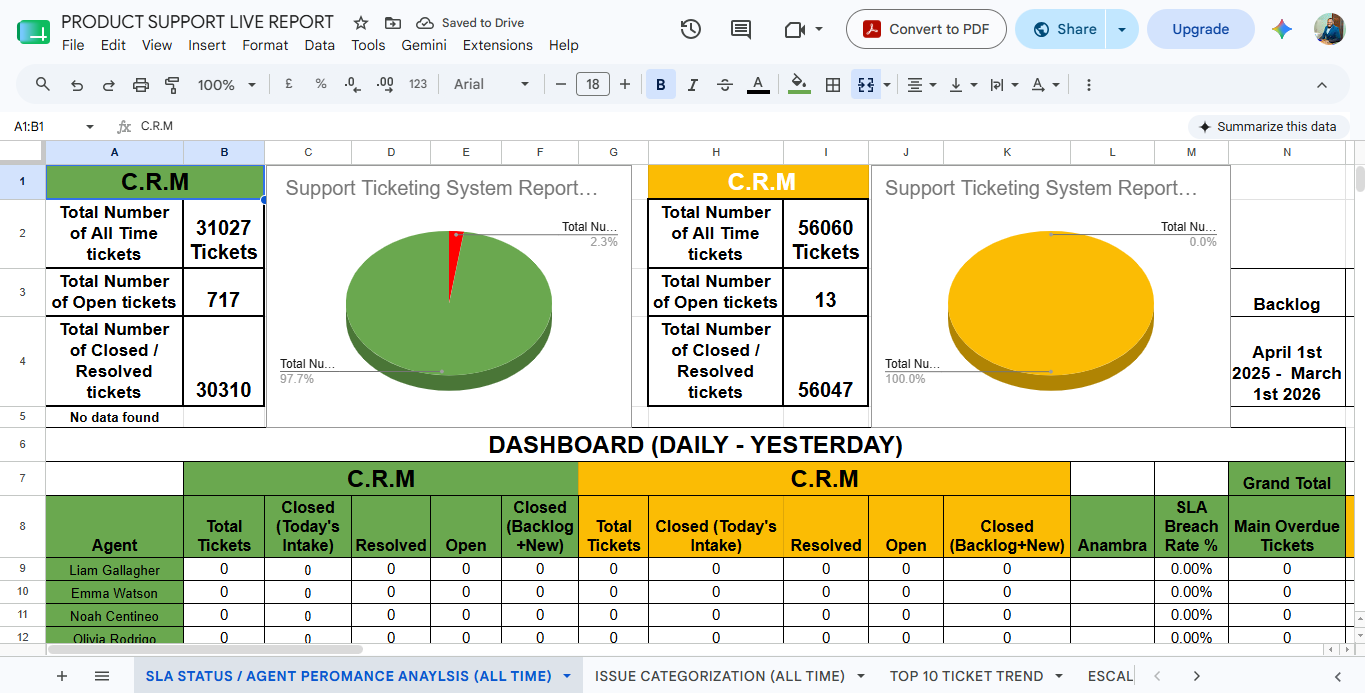
Customer Support & Agent Performance
Live analytics dashboard for monitoring support operations, ticket trends, and agent productivity.
-
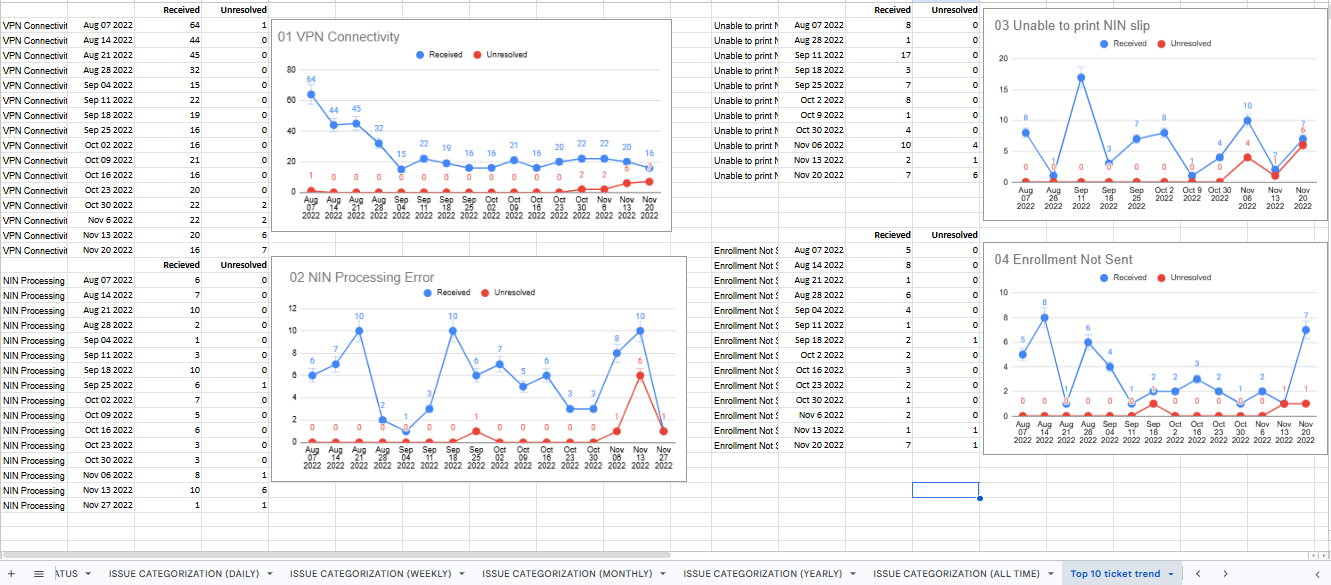
Top Issue Categorization & Ticket Trend
This report identifies the most frequently reported customer issues over time, helping engineering and product teams prioritize fixes based on real customer demand rather than assumptions.
-
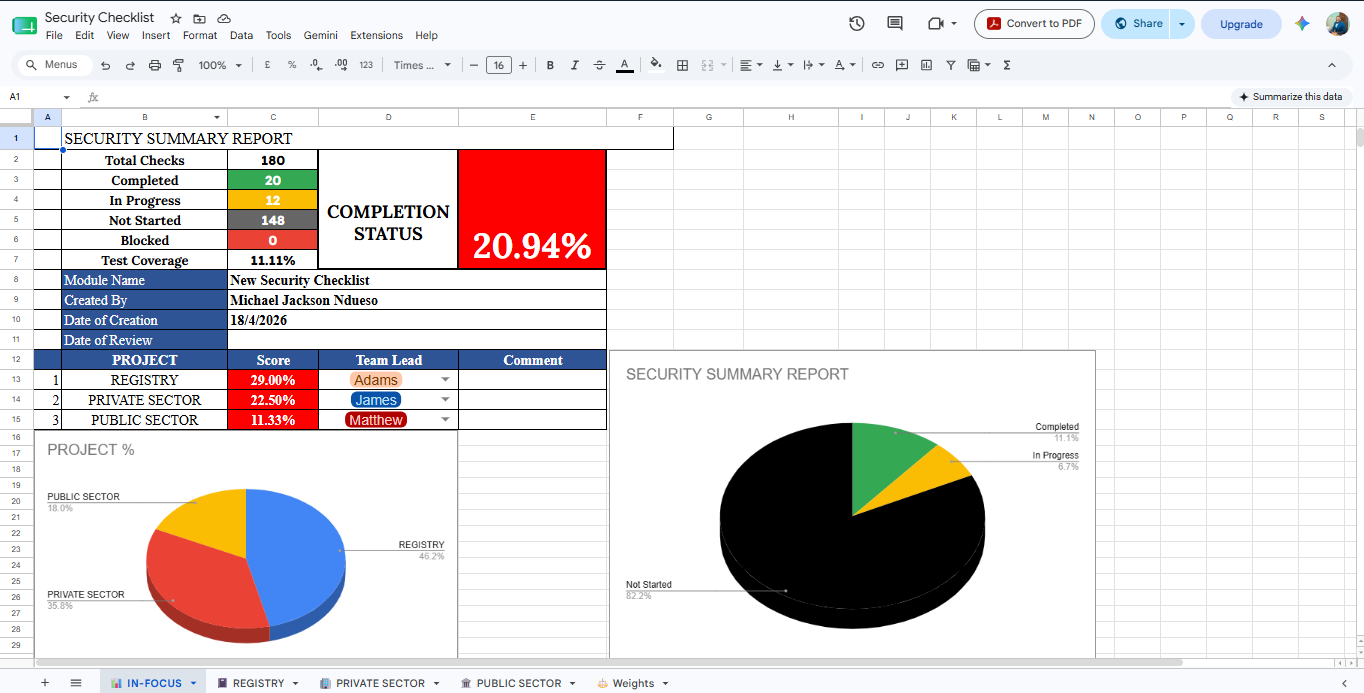
Security Controls & Compliance
Tracks security validation activities, compliance progress, and readiness for release.
-
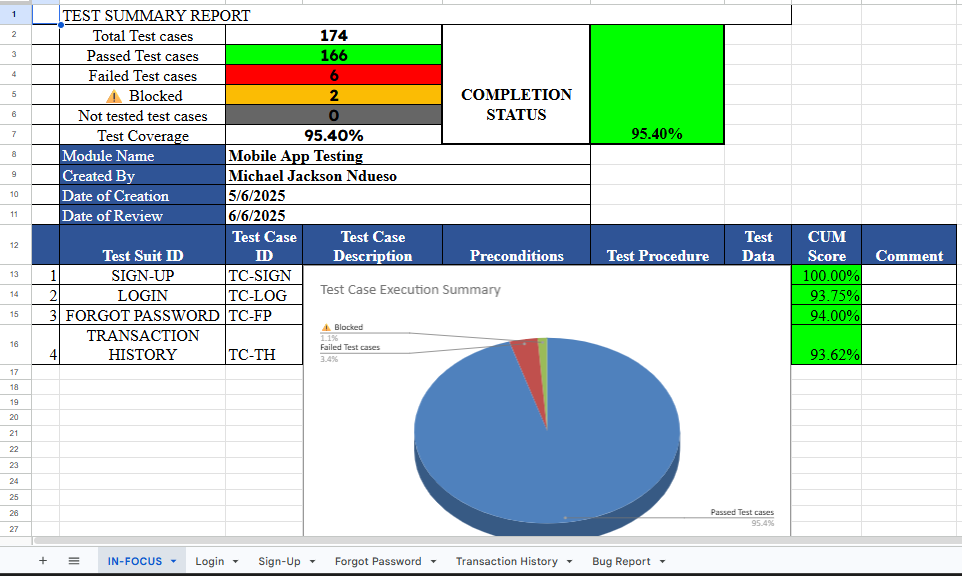
Master Test Repository
Centralized repository for test execution, planning, and release readiness.
-
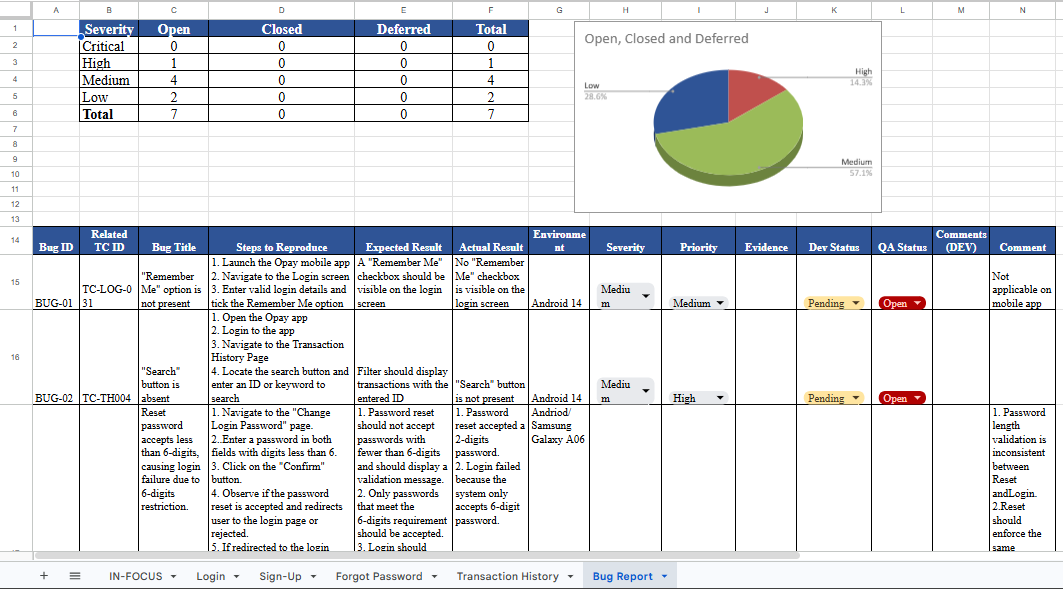
Defect Management
Tracks defect trends, severity distribution, and software quality metrics.
-
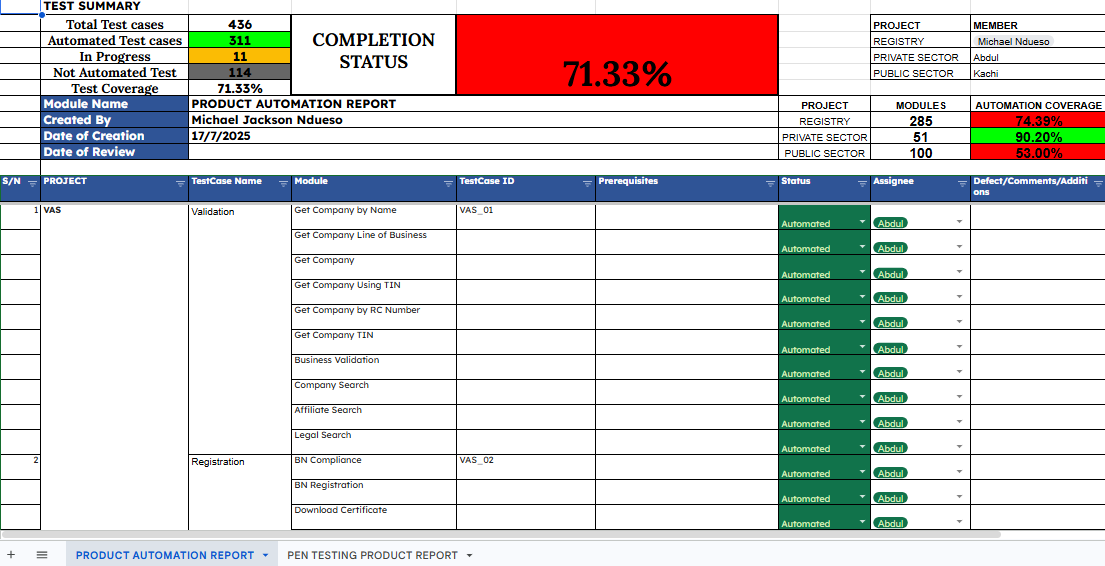
Automation Coverage
Measures automation maturity and release confidence.
🏗️ Engineering Capabilities
These dashboards demonstrate more than reporting,they showcase how spreadsheet engineering can be used to automate business processes, improve visibility, and support software delivery.
Across these systems I applied:
-
Analytics
Built dashboards that transform raw operational and QA data into actionable insights through charts, KPIs, and live reporting.
-
Automation
Automated repetitive reporting using advanced Google Sheets formulas, dynamic calculations, and cross-sheet integrations.
-
Data Integration
Combined data from multiple worksheets and repositories into centralized dashboards using dynamic references and lookup functions.
-
Stakeholder Reporting
Designed dashboards that allow engineering teams, managers, and stakeholders to monitor project health in real time.
Engineering Principles
Every dashboard follows the same design philosophy:
- Automation over manual reporting
- Real-time visibility
- Reliable data sources
- Clear visualizations
- Scalable architecture
- Stakeholder-friendly reporting
📈 Customer Support & Agent Performance Analytics
📊 System Overview
A live operational dashboard engineered to monitor helpdesk efficiency, categorize incoming support requests, and visualize ticket lifecycles.
It provides real-time visibility into individual agent productivity alongside historical ticket volumes aggregated across Daily, Weekly, Monthly, Yearly, and All-Time reporting periods to identify performance trends and operational bottlenecks.
One of its key capabilities is analyzing ticket categories to identify the most frequently reported issues. This enables engineering and product teams to quickly recognize recurring problems, prioritize high-impact defects, and focus development efforts on issues affecting the greatest number of users.
⚙️ Engineering Techniques
The dashboard automatically synchronizes data from multiple Google Sheets and generates live operational reports using advanced spreadsheet engineering techniques.
IMPORTRANGEFILTERUNIQUECOUNTIFSCOUNTASUMIFSIFERROR
✨ Key Insights Delivered
- Live agent productivity monitoring
- Ticket volume trends across multiple time periods
- Top issue categorization and recurring problem analysis
- SLA and operational performance visibility
- Data-driven prioritization of production fixes
- Executive reporting through interactive dashboards
📸 Dashboard Preview
Overall Customer Support Dashboard
Top Issue Categorization & Ticket Trends
This visualization helps engineering and product teams identify the most frequently reported issues, prioritize high-impact fixes, and make informed decisions about production improvements based on real user data.
Live demonstration available during interviews or upon request.
🔐 Security Controls & Compliance
📊 System Overview
A centralized compliance dashboard used to audit application security controls against security requirements and testing standards before production deployment.
It helps ensure security validation activities are completed while providing visibility into outstanding compliance risks.
⚙️ Engineering Techniques
VLOOKUPCOUNTACOUNTIFS
📸 Dashboard Preview
Live demonstration available during interviews or upon request.
🧪 Master Test Repository
📊 System Overview
A centralized testing repository combining test planning, execution tracking, and defect management.
It provides QA teams with a complete view of testing progress, release readiness, software quality metrics, and testing coverage throughout the software development lifecycle.
⚙️ Technologies Used
COUNTIFSCOUNTASUM
📸 Dashboard Preview
Live demonstration available during interviews or upon request.
🐞 Defect Management Dashboard
📊 System Overview
A live defect analytics dashboard engineered to monitor software quality by tracking defect trends, severity distribution, resolution progress, and outstanding issues throughout the testing lifecycle.
The dashboard provides engineering teams with actionable quality insights that support release planning and continuous improvement.
⚙️ Technologies Used
COUNTIFSCOUNTASUM
📸 Dashboard Preview
Live demonstration available during interviews or upon request.
🤖 Product Automation Coverage Report
📊 System Overview
A quality metrics dashboard designed for engineering teams and product stakeholders.
It measures automation maturity across projects by comparing automated test coverage against manual testing efforts while reporting automation stability, regression coverage, release confidence, and overall automation progress.
⚙️ Technologies Used
COUNTIFSSUMCOUNTA
📸 Dashboard Preview
Live demonstration available during interviews or upon request.
🛠️ Engineering Stack
These dashboards were engineered using the capabilities of Google Sheets to build scalable reporting systems rather than simple spreadsheets.
Technologies and techniques include:
Reporting - Dashboard Design - KPI Reporting - Data Visualization Automation - Formula Engineering - Spreadsheet Automation - Process Automation Quality Engineering - QA Metrics - Defect Tracking - Test Management Collaboration - Stakeholder Reporting - Operational Reporting - Business Process Improvement
💡 Skills Demonstrated
Throughout these engineering projects, I applied:
- Google Sheets Automation
- Dashboard Design
- Formula Engineering
- Process Automation
- Data Analysis
- Data Visualization
- QA Metrics
- Defect Tracking
- Test Management
- Operational Reporting
- Stakeholder Reporting
- Performance Monitoring
- Security Compliance Tracking
- Automation Coverage Reporting
- Spreadsheet Engineering
- Reporting Automation
- Business Process Improvement
📈 Business Impact
These reporting systems reduced manual reporting effort by automating repetitive calculations, centralizing project data, and presenting real-time engineering metrics through interactive dashboards. They enabled QA teams, engineering managers, and stakeholders to monitor project health, identify bottlenecks earlier, and make faster, data-driven decisions throughout the software development lifecycle.
By automating calculations and presenting live engineering metrics, stakeholders could monitor progress instantly, identify bottlenecks earlier, and make faster, data-driven decisions throughout the software development lifecycle.
The reporting systems also helped standardize quality metrics across projects, improving collaboration between QA, engineering, product, and management teams.
🚀 Continuous Improvement
These dashboards continue to evolve as new reporting requirements emerge.
I regularly refine calculations, improve automation workflows, simplify reporting experiences, and expand dashboard capabilities to ensure stakeholders always have accurate, actionable insights.
My objective isn't simply to report data, it's to engineer reporting systems that transform raw operational information into actionable insights that improve software delivery.
Related Engineering Projects
"Good dashboards report the past. Great dashboards help teams improve the future."